When a test fails inside a plan, the result row shows:
Click the row to drill into the full Test Report with screenshots, AI requests, and replay video.
The Trigger column shows which one, so you can separate ad-hoc runs from CI gates from scheduled checks at a glance.
Someone clicked Run
A cron job fired
Triggered from your CI pipeline
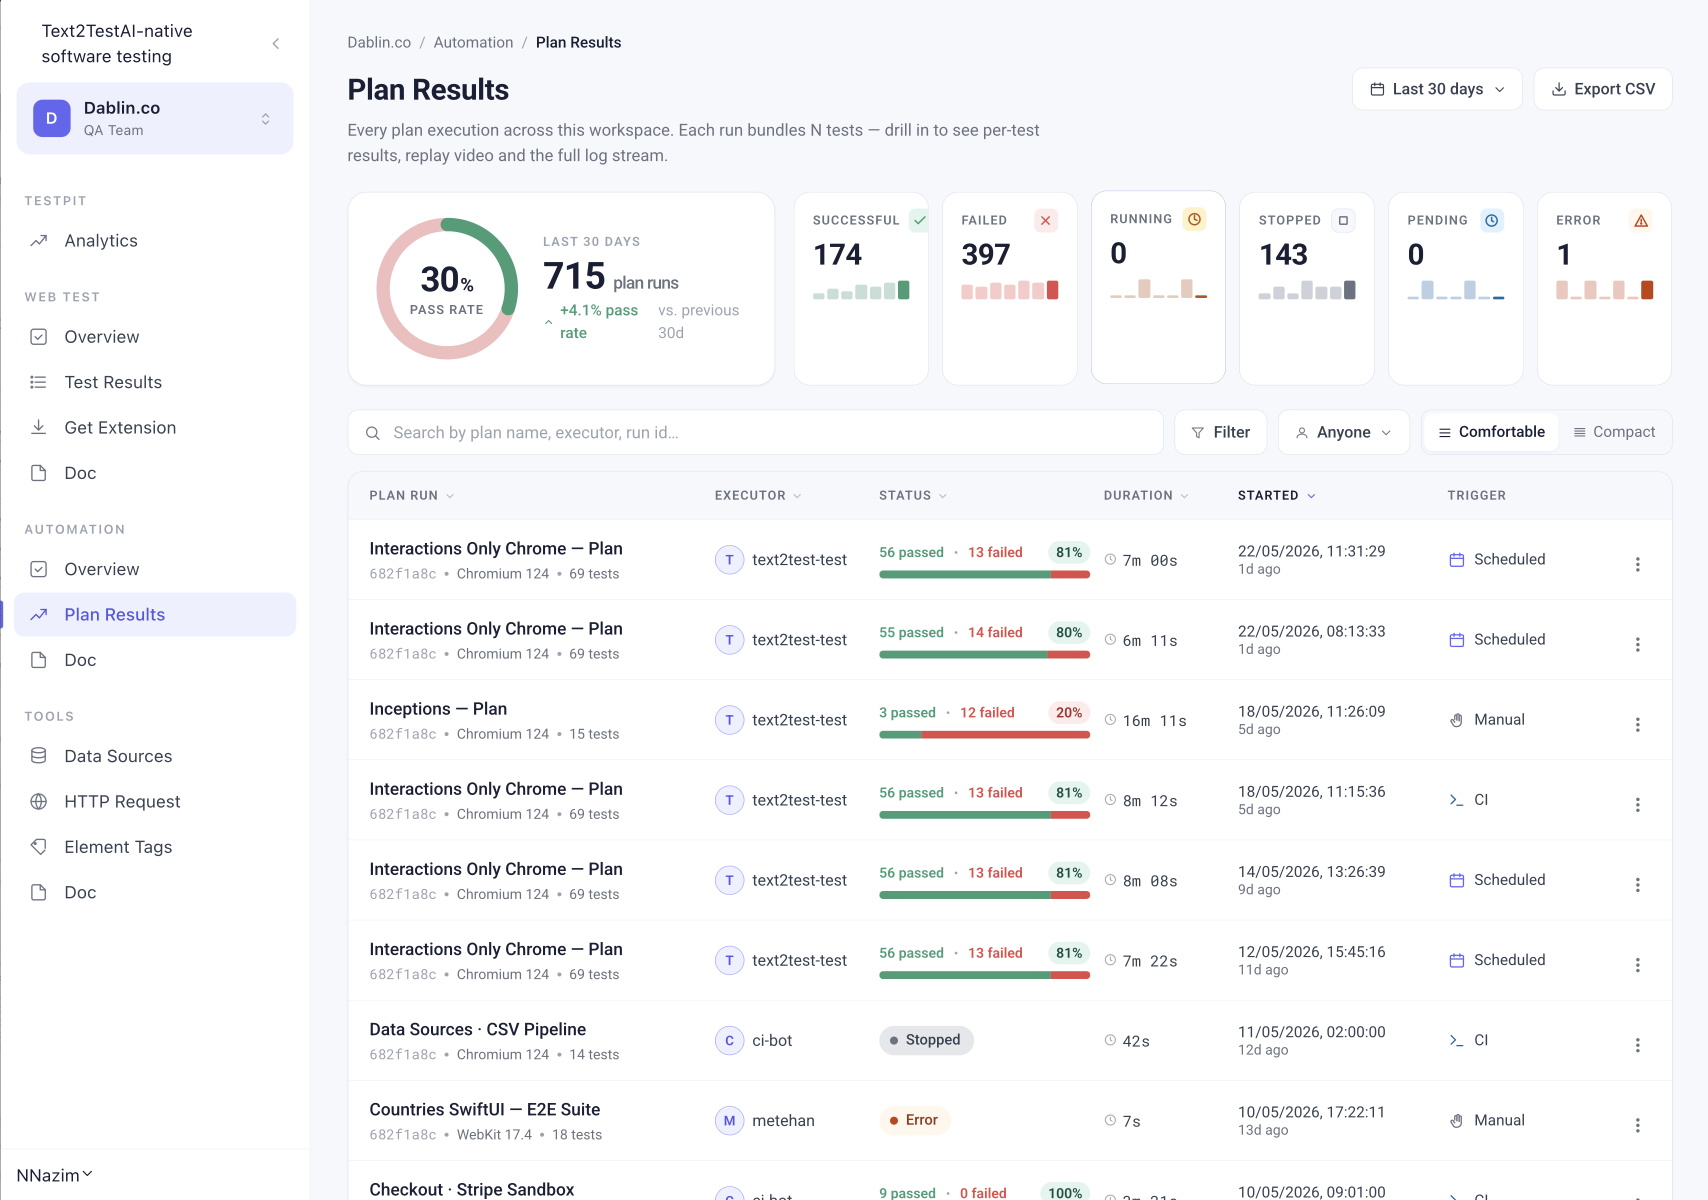
A single pass rate number is a snapshot. A pass rate over 30 days is a trend. Text2Test surfaces both, so you can answer "are we getting better or worse?" in one glance.
Every dashboard compares the current window to the previous one. +4.1% pass rate this month versus last. Catch direction, not just position.
30 daily bars on each card. Spot the bad day, the bad week, the moment something broke. Hover for the exact run count.
A single donut at the top of every report. 30 days, every run included. The number that goes in your sprint review.
See how Plan Reports turn scheduled runs into something your team can act on. Live demo, your plans.
Request a Demo