Text2Test Logo
Request a Demo

Bundle, schedule, run, drill in. Test automation that holds up at scale.

Group test cases into directories. Bundle them into plans. Schedule them or kick them off from CI. Every run captures pass rates, failure reasons, executors, and per-test results. Drill into any plan run and see which step broke, with the error inline.

Request a Demo
Text2Test Plans overview with stats and saved plans table
How it works

From test cases to scheduled coverage in four steps.

Once your test cases exist, automation is one wizard away. A guided four-step flow turns a pile of tests into a scheduled plan that runs on browsers you choose, alerts the right people on failure, and captures everything you need to debug after the fact.

01

Plan details

Name the plan. Set a schedule (cron-style or off). Add email recipients and pick when they fire (on failure, on success, always). Choose setting profiles, browsers, parallel execution, retries, and reporting (video, step details).

02

Select tests

Pick tests from your project tree. Search by name, filter by tag, or import a selection from another project. The side panel keeps a running count as you build the plan.

03

Order tests

Set the run order. Some tests need to run after others (login first, then authenticated flows). Drag to reorder.

04

Data source

Bind a data source to the plan. CSV, API fixture, or a saved HTTP Request. The plan runs once per row, so coverage scales with your data set.

Structure that scales

Two units of organization. That's all you need.

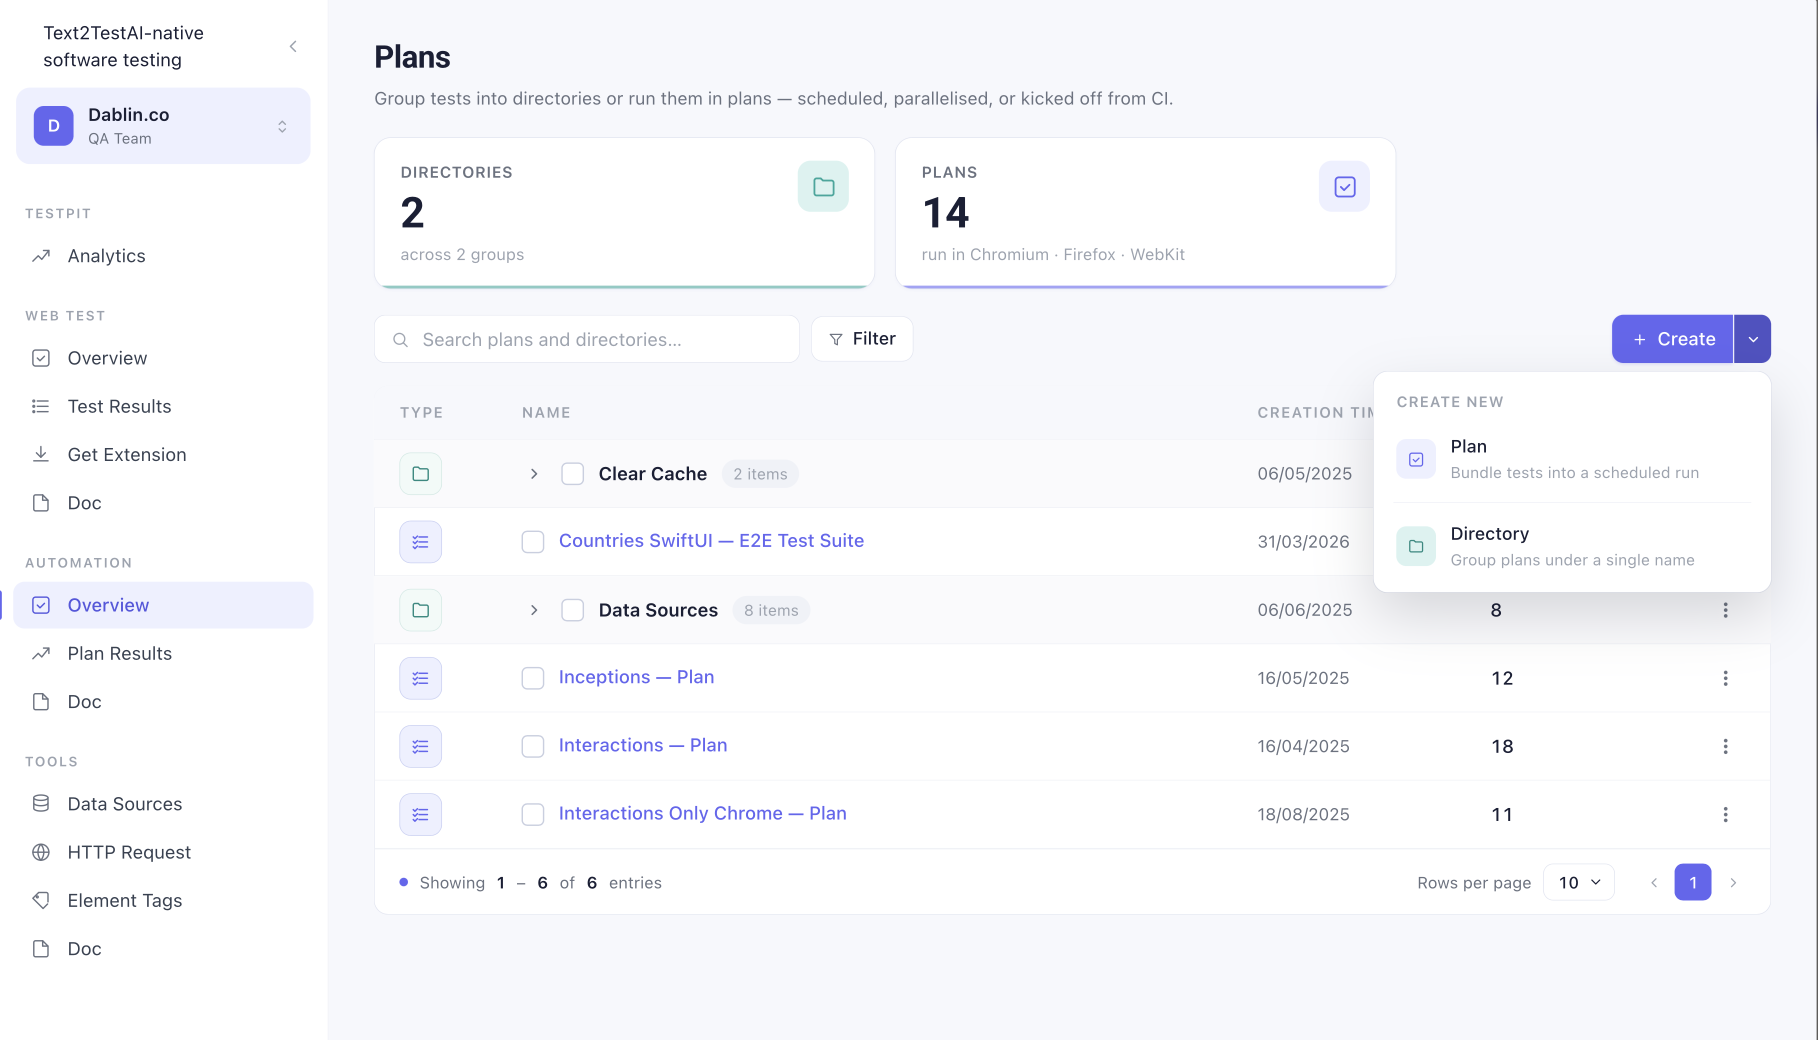
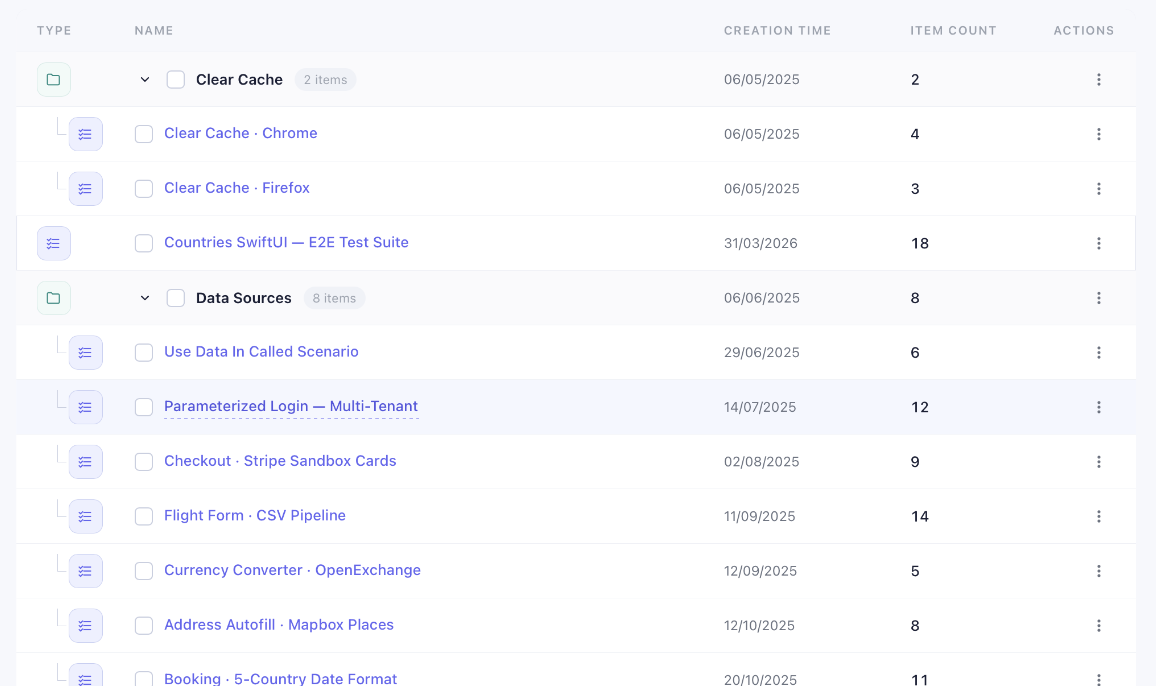
Directories group related plans under a single name. Useful when one product surface has several plans (smoke, regression, full suite) and you want them grouped without flattening into a single bucket.

Plans are the runnable unit. A plan owns its own schedule, browser matrix, recipient list, and data source binding. One plan, one run, one result.

The overview keeps both visible at the same level so you can see the whole tree without clicking through layers.

Text2Test Plans overview showing Authentication and Onboarding directories with their plans
After the run

Every plan run, drillable to the failing step.

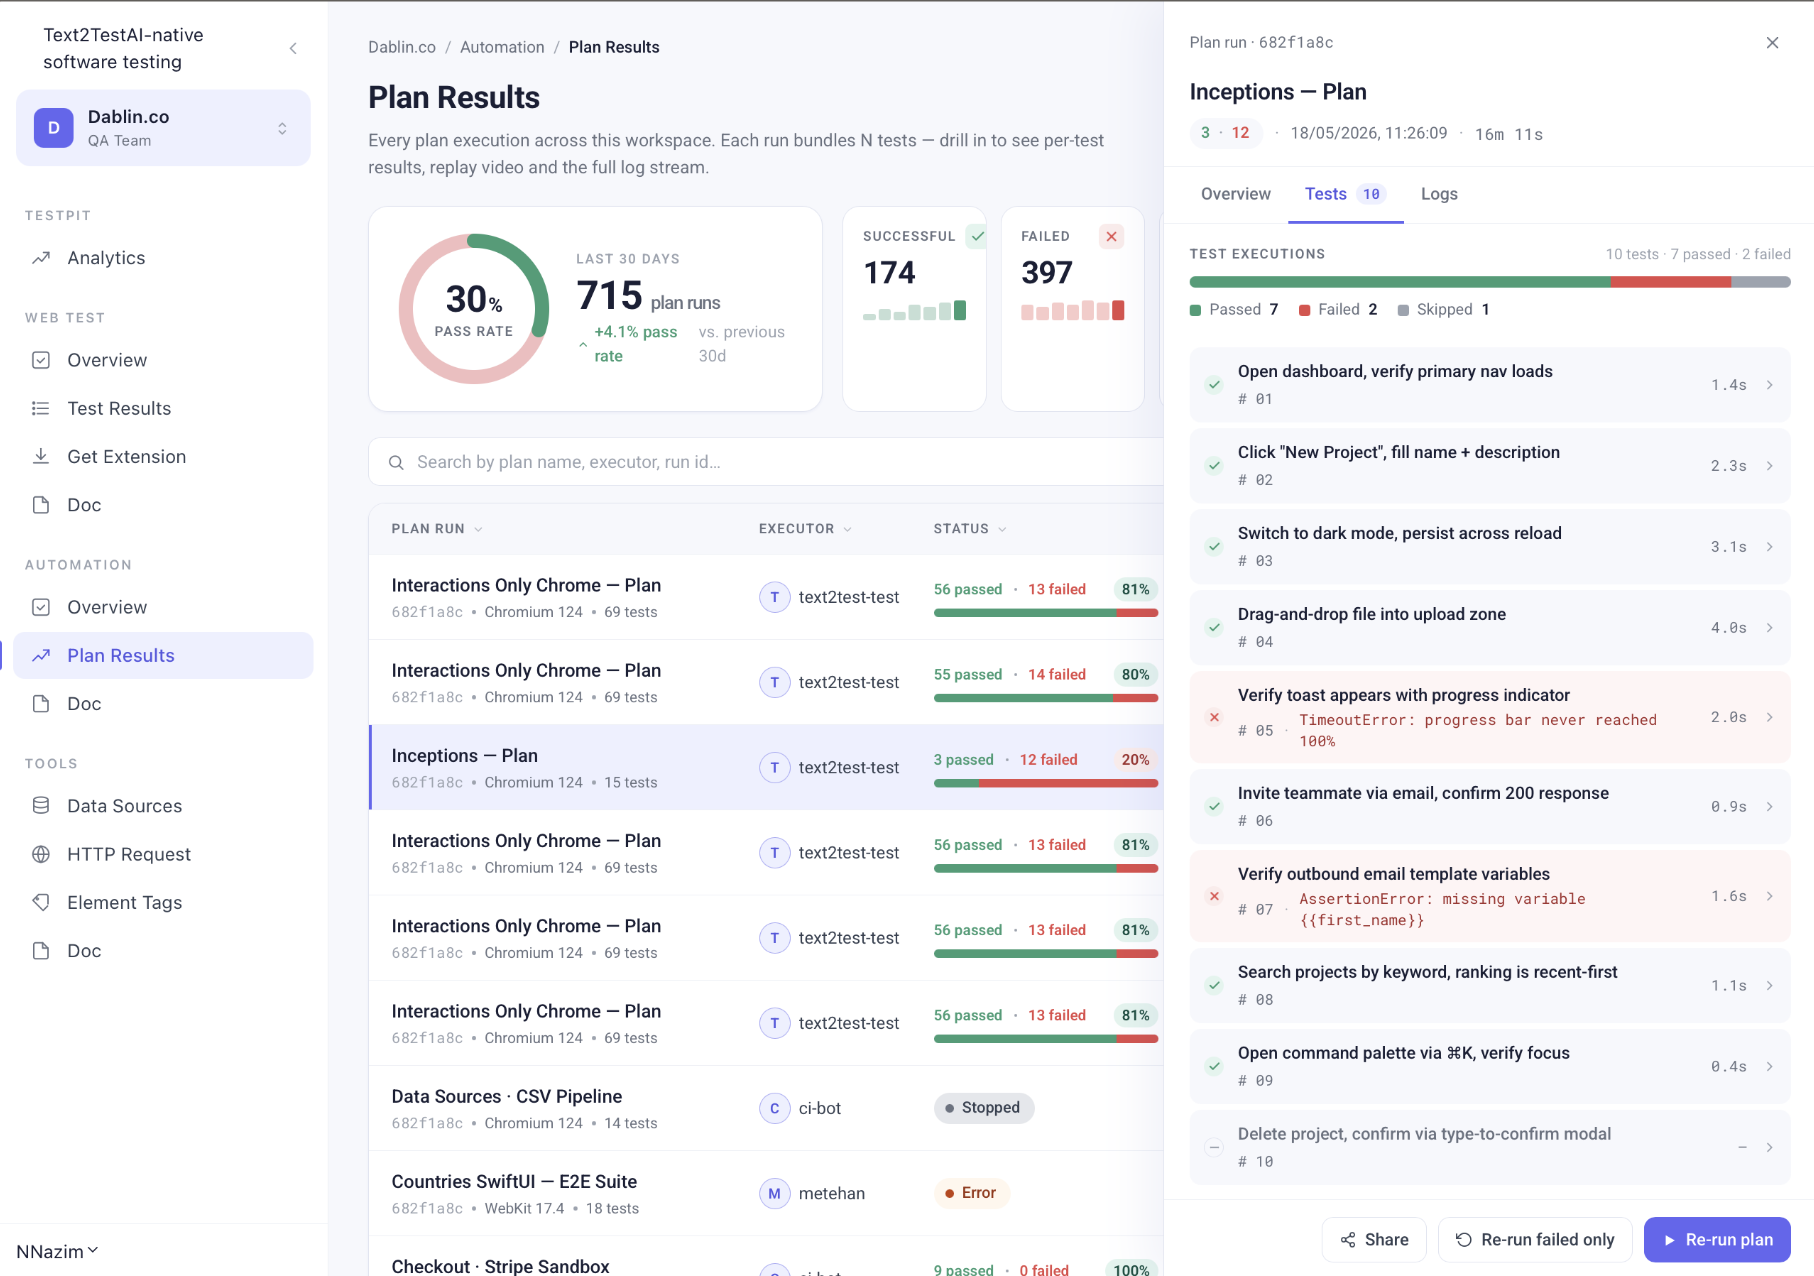
Every plan execution is captured. The Plan Results view shows the last 30 days at a glance: pass rate trend, total runs, success and failure counts, and a per-run table with executor, browser, test count, and pass/fail split.

Click any plan run and the side drawer opens with:

All tests in the run, passed and failed
Inline error snippets on failures (TimeoutError, AssertionError, message previews)
Per-test duration so you can spot slow steps
Re-run failed only · Re-run plan · Share

The same drawer surfaces from the Testpit analytics page, so wherever you spot a regression you can drill into the run that caused it.

Cross-browser by default

Chromium, Firefox, WebKit. Pick one. Pick all three.

Every plan runs on the browser matrix you choose. The default is Chromium, but Firefox and WebKit are one click away in the Test options panel. Parallel execution runs all selected browsers at the same time, so a 20-minute suite finishes in roughly the same time across one browser or three.

Chromium
Firefox
WebKit
Scheduled, parallelised, or kicked off from CI

Four ways to trigger a plan.

Run now

Hit the Run button. The plan executes against the browser matrix you configured. Most teams start here, then layer in scheduling once the suite is stable.

Schedule

Runs the plan at a defined cron. Hourly, daily, before every release. Catches regressions between deploys, not just during them.

Parallel execution

Spreads tests across workers so a long suite finishes fast. Same plan, more workers, same result.

CI/CD integrations

Trigger plans from GitHub Actions, GitLab CI, CircleCI, Jenkins, and Bitbucket Pipelines. JUnit XML output means PR gates and status checks work out of the box.

Failures, not just failure counts

A failed test should tell you what to fix.

When a step inside a plan fails, the result row carries the error inline. TimeoutError with the step that timed out. AssertionError with the variable that was missing. Network errors with the request that returned the wrong status.

Click into the test and you get the full step-by-step replay, the screenshots captured at each step, and the video of the run if you enabled it in Reporting settings.

Text2Test plan run drawer showing failing tests with inline error snippets
Automation runs your full mix

Whatever you put in a test case, the plan runs.

Plans don't care which sequence types are in your test cases. T2T Native, Autopilot, Script Injection, Visual Verification, HTTP Request, all run inside the same plan, on the same browser matrix, on the same schedule. Mix freely.

T2T NativeScript InjectionAutopilotVisual VerificationHTTP Request
FAQ

Common Questions

Bundle once. Run forever.

See how Plans and Directories turn a project tree into scheduled coverage. Live demo, your stack, your tests.

Request a Demo